Commodity-price risk intelligence

See commodity price risk across your contract portfolio.

RiskLens maps contract records to commodity signals, identifies exposed suppliers and categories, and explains where cost pressure may hit next.

Know which contracts are exposed before prices move against you.

Diesel +4.2%
Steel +2.8%
Energy +1.9%
ONS PPI · live
RiskLens · Portfolio exposure
Top exposuresclick a driver
Fuel88
Steel72
Food61
Energy54
Construction43
Live Fuel drives 512 exposed contracts · £41.2m
Portfolio exposure mapSupplier risk viewCategory risk viewContract-level scoringMarket movement timelineCommodity mappingTransparent 0–100 scoringPlain-English briefingsCSV & PDF exportsRead-only, audit-friendly
The problem

Commodity risk hides inside your contract register.

Prices move in the market long before they show up in a contract review. By the time the cost lands, the window to act has usually closed.

Energy ▲ +1.9%
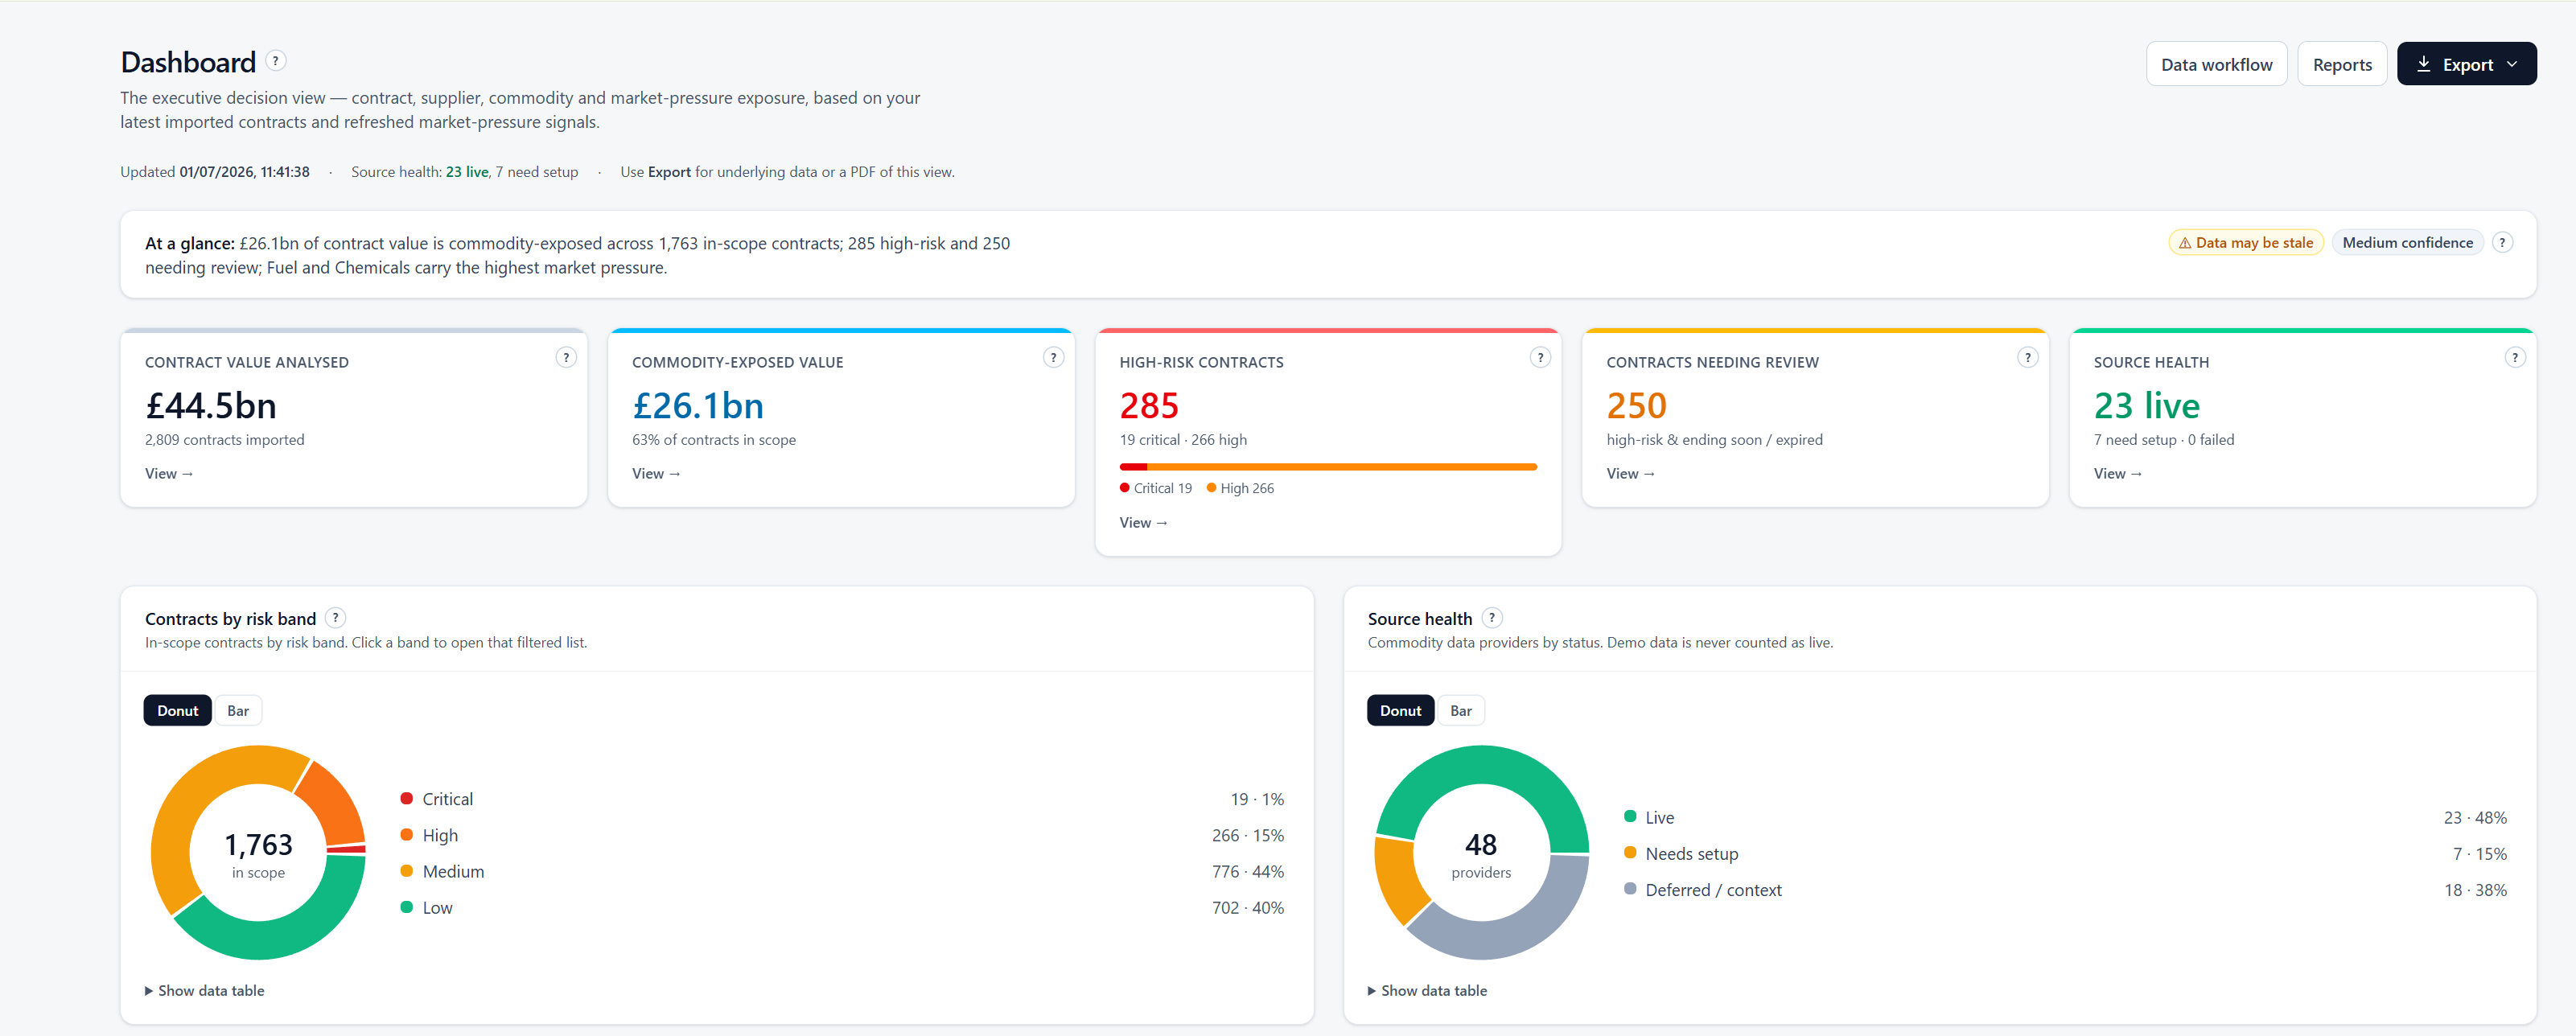
Exposure 63% in scope
Steel rebar ▲ +2.8%
Fuel index 90-day
Pennine Surfacing Supplier · 6
ONS PPI feed Live source
contracts.xlsx 2,809 rows
Food & catering 88 exposed
Risk bands 1,763
Contract R-4821 £14.9m
Diesel ▲ +4.2% · 30d
Timber ▼ −0.4%
RiskLens
Scattered signals.
One clear lens.
How it works

Turn scattered signals into structured action.

Five product stages — a live look at each one. click the steps & play inside the panels

1

Signal capture

Contract data and live market signals land in one place — source systems, spreadsheets and official price feeds.

2

Risk scoring

Each contract gets a transparent 0–100 score built from named, checkable factors.

3

Supplier exposure

See which suppliers concentrate your exposure, then drill into their contracts.

4

Contract & commodity pressure

Map contracts against commodity groups and where market pressure is building.

5

Recommended review action

A prioritised, plain-English action list — queue what to review next.

The product

Everything you need to see exposure clearly.

RiskLens dashboard — portfolio exposure
Inside the cockpit

Every number traces back to evidence.

Open any contract and see exactly why it scored the way it did — the commodities it's linked to, the market pressure behind them, and the data-quality caveats.

Transparent, explainable scoring on every contract

Data-quality gaps surfaced, never hidden

CSV exports ready for Excel, finance and committee

Governance & security

Built for contract review — not black-box prediction.

Read-only data import

Your source export is only ever read, never changed.

No supplier system access

RiskLens sits above your systems — it doesn't plug into supplier accounts.

No automated decisions

It flags and ranks; the decision always stays with your team.

Explainable scoring

Every score breaks down into named, checkable factors.

Audit-friendly outputs

Exports designed to stand up in review and committee.

RLS & least-privilege

Row-level security on every table; no service keys in the browser.

FAQ

Questions, answered.

No. RiskLens shows exposure and market pressure — which contracts could cost more when raw-material prices move — not a precise forecast. Scores are an indicative, explainable ranking.

A contract export from any source system — SAP, Oracle, Coupa, Excel or another register. RiskLens auto-detects the columns and reads the file without changing it.

No. It's an intelligence layer that sits above your existing systems. Nothing is written back, and no supplier-system access is required.

Row-level security is enabled on every table, secrets stay server-side, and the marketing site holds no app data. Real contract exports stay on the operator's machine and are never committed.

Thirteen raw-material groups — energy, fuel, asphalt/bitumen, aggregates, steel & metals, timber, cement & concrete, food, chemicals, vehicles & parts, ICT hardware, paper/packaging, and plants/grounds.

Know your exposure before prices move.

Request access and see which contracts in your portfolio are exposed to commodity price risk.